Urban Energy Mapping using LiDAR
Rory Tooke (PhD Completed)
The activities and processes that occur within cities demand substantial resources and energy. Depending on accounting methods for the upstream, downstream and embodied energy of goods and services, cities are estimated to contribute between 30 – 70% of global energy demand. Policies and planning that elicit action at the local level are therefore critical to negotiating a path towards a more sustainable future.
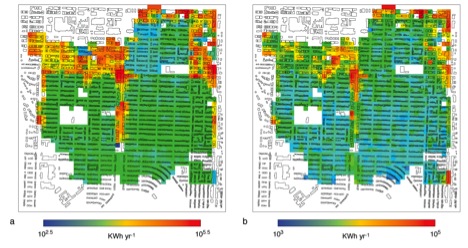
Figure 1. Nominal annual energy demand for a) water heating and b) space heating.
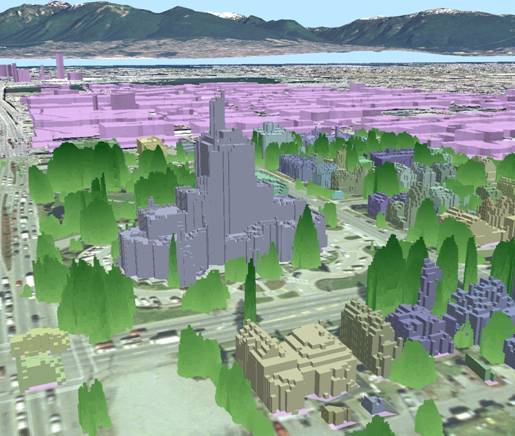
To support local planning processes addressing energy use, geographic information systems (GIS) have been attributed with details related to the local environment and building energy factors. As a compliment to this trend of increasing the spatial representation of energy-related variables is the integration of detailed three-dimensional (3D) models of the urban environment.
Specifically, airborne Light Detection and Ranging (LiDAR) data offers a contiguous representation of urban form at a spatial scale suitable to help populate individual building energy simulation and modeling. Furthermore, LiDAR datasets are becoming commonplace in municipal and regional data libraries.
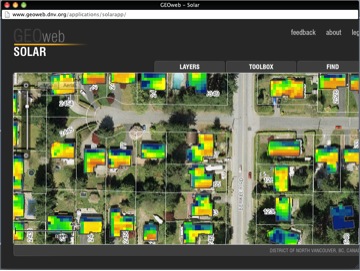
Figure 2. Example of the District of North Vancouver’s Solar Calculator tool.
We develop techniques for generating comprehensive estimates of building energy demand and potential solar supply across entire urban regions based on LiDAR data inputs. In relation to demand, the LiDAR data is used to 1) provide building massing details, 2) predict building age, which allows the computation of building energy parameters (insulation, air leakage, fenestration), and 3) to assess the influence of the local environment on energy gains and losses by accounting for envelope obstructing features. Similarly, solar supply potential is determined using the LiDAR to calculate roof slope, orientation and obstructing features.
Results of this research have enabled more robust and spatially detailed estimates of energy demand and supply. These efforts have helped inform various local energy strategies. In partnership with the District of North Vancouver, the Integrated Remote Sensing Studio developed the Solar Calculator, which allows local residents to determine total available rooftop solar energy, and won the 2010 Union of BC Municipalities Leadership and Innovation Award.
Spatial interactions between vegetation and urban physical and social processes: A holistic approach to urban green-space analysis
Rory Tooke (MSc completed)
 The new ecological paradigm recognizes that humans are important components of ecosystems. This paradigm is easily understood when observing urban areas where human interactions with the local environment produce dramatic spatial variations in physical and social processes. The fine-scale heterogeneous composition of these environments results in complex spatial processes which are becoming progressively better understood with the aid of advanced satellite remote sensing technologies and geographic information systems (GIS). The following research is broken into three key components of urban systems which integrate to provide a holistic approach to urban analysis. Integrating vegetation estimates with urban physical and social processes enables a comprehensive understanding of the city and forms the foundation of this research project.
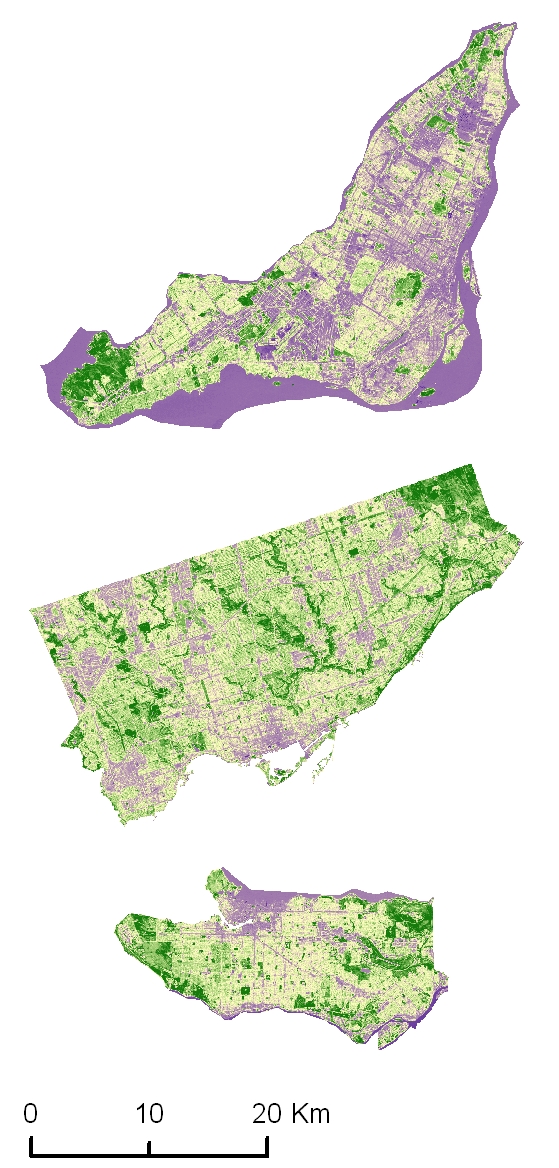
The first area of analysis involves extracting detailed urban vegetation characteristics using high spatial resolution satellite imagery. Accurate and detailed estimates of vegetation cover in the city of Vancouver are derived through dividing satellite image pixels into representative fractions of grass and trees. In addition, ground based observations of vegetation characteristics are used to explain how different vegetation conditions and species affect this analysis. Vegetation is a critical urban land cover feature, and separating vegetation into more detailed characteristics will significantly advance the parameterization of urban micrometeorological models. In addition, quantifying the distribution and abundance of urban vegetation can inform planners of the spatial variability of environmental equity across cities. The micrometeorological and environmental equity applications of satellite derived vegetation estimates are the subject of the remaining two sections of this research.
 Urban physical processes including air quality, wind, temperature, moisture, and precipitation regimes are highly dependent on the distribution and abundance of vegetation in a city. Detailed vegetation characteristics, such as the structure of plant canopies and their health also exert a strong influence on urban wind flow and rates of transpiration. This second area of research will
quantify the seasonal effects of vegetation type and pattern on urban microclimates by integrating vegetation estimates with multi-temporal thermal satellite imagery.
The varying distribution of social and environmental features across space is the third focus of this research. This section focuses on issues of environmental equity which is the notion that environmental impacts and amenities should be equitably distributed within society regardless of class, income, race, or education. The objective of this research is to provide inter- and intra-city assessments of environmental equity in several major Canadian cities by combining satellite derived vegetation estimates with census data.