Integrating advanced spectral and structural remotely sensed data to improve vegetated terrestrial ecosystem mapping
Trevor Jones (PhD completed)
Gaining access to information on the composition and structure of the world’s vegetated ecosystems is a fundamental requirement for the sustainable management of our environment. Within Canada, the newly formed Gulf Islands National Park Reserve (GINPR) protects the terrestrial and aquatic ecosystems representative of the Strait of Georgia natural lowlands region. In order to reliably monitor and manage the various ecosystems within the GINPR, Parks Canada requires accurate and up-to-date information on species composition and forest structure. At present, Park managers use information yielded from conventional Terrestrial Ecosystem Mapping (TEM) to provide required ecosystem attribute information. Despite the necessity for the baseline information that TEM provides, it is costly and requires significant interpretation making it poorly suited for stand alone use in long-term operational monitoring. New state-of-the-art methodologies augment currently utilized approaches and involve the integration of Light Detection and Ranging (LiDAR), hyperspectral and multispectral remotely sensed data, supplemented by ground-based spectroscopy information and field measurements. Separately, these disparate types of remotely sensed data have been used with success to provide information on vegetated terrestrial ecosystems. However, no single remote sensor can provide extant vegetative information required by managers. Therefore, combining multiple types of data is a necessary step in the evolution of vegetative ecosystem mapping and monitoring.
Determining vegetative species composition
In order to reliably and accurately provide compositional information the ability to differentiate between species is required. Different species of vegetation have distinguishable spectral response curves which can be abstracted by remotely sensed data. Species specific curves are a result of the variable presence (or lack there of) of certain pigments, water and organic compounds. Furthermore, the internal cell structure of leaves has a major impact on the spectral signature associated with particular species. For all vegetative species, the reflective properties of healthy green vegetation vary throughout the electromagnetic spectrum.
Similar to airborne hyperspectral sensors (discussed below), ground-based spectroradiometers simultaneously abstract hundreds of contiguous narrow portions of the electromagnetic spectrum. As opposed to being mounted on satellite platforms or aircraft, ground-based spectroradiometers are either hand held or supported by various means (i.e., tripods, cherry pickers). Spectroradiometers allow for a finer and more detailed scale of investigation then that provided by air or space borne remote sensing devices. As a result, the detailed spectral curves retrieved for various earth surface materials using these devices are accurately able to distinguish between subtle spectral differences. The identification of subtle spectral differences can allow for the discrimination of vegetative species, information which can subsequently be scaled up to be used in conjunction with air or space borne remote sensing devices. This research uses a spectral library of vegetative samples collected on site in throughout the GINPR. Samples were collected in order to capture the spectral variability present in sunlit areas of dominant tree species. The spectral response curves of collected spectra samples were determined for each sample using an Analytical Spectral Devices (ASD) Full-Range (FR) spectroradiometer (Analytical Spectral Devices, Boulder, CO, USA: http://www.asdi.com/). In total, 360 samples representing 11 tree species were collected and spectra curves subsequently retrieved.
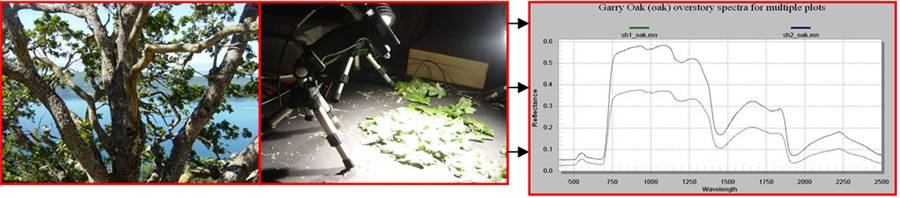
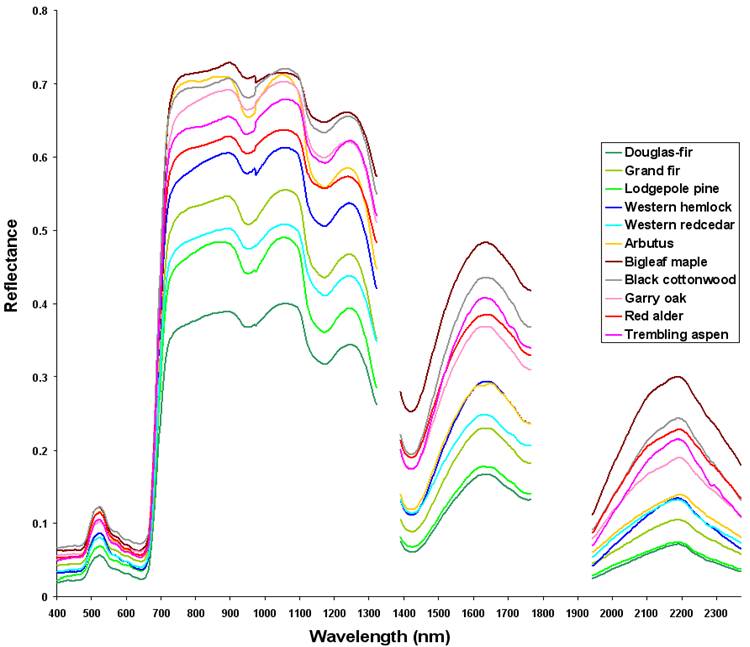
These data were then used to assess the spectral differentiability among dominant tree species within the spatial extent of hyperspectral transects flown within the southern Gulf Islands, including portions of GINPR land. Specifically, ASD data were first smoothed and curve shapes were determined using first and second derivative operators. Stepwise discriminant analysis was then used to examine the between and within species differentiability, identifying regions of the spectrum most capable of species discernment.
Hyperspectral remote sensors acquire image data simultaneously in upwards of hundreds of narrow, adjacent spectral channels (Smith 2006). Each picture element of a hyperspectral image contains a complete reference spectrum (Goetz 1992). A wide variety of hyperspectral remotely sensed data are currently available and differ in their spatial and spectral resolutions. Hyperspectral images are currently being collected by a variety of sensors called imaging spectrometers (Smith 2006). This research employs hyperspectral imagery collected by the AISA dual sensor (Spectral Imaging, Ltd., NASA and Spectrum Mapping: http://www.specmap.com/rem-hyper-aisa.html). The AISA Dual combines the spectral range of the AISA Eagle (i.e., 395-970 nm) and AISA Hawk (i.e., 970-2503 nm) to allow the collection of hyperspectral data simultaneously from 395-2503 nm over 492 spectral channels. When flown at an approximate altitude of 1600 m (as flown for this research), the AISA Dual yields a spatial resolution of 2 m. The spatial resolution of AISA imagery, combined with the enhanced spectral resolution provides a reasonable scale for investigating tree species discrimination.
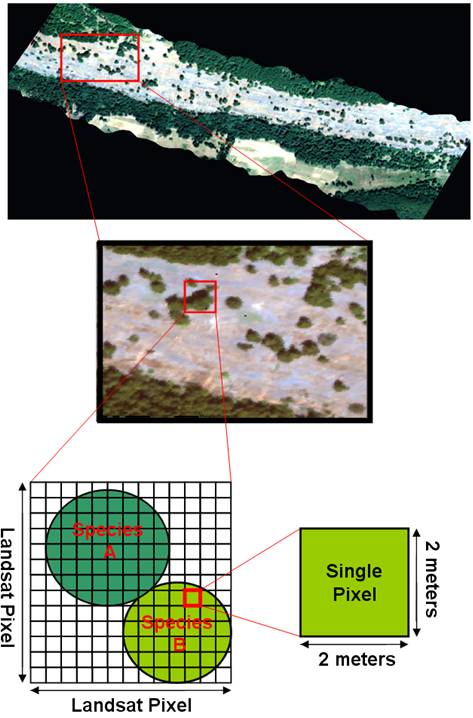
Ranges of the electromagnetic spectrum identified as optimal for species differentiation using ASD data were targeted in the AISA data. Using the species specific spectral library as reference, these optimal portions of the spectrum as represented as AISA bands are being targeted in the classification of the imagery with the aim of producing species compositional maps. At present, this phase of the work has reached the classification stage and remains in progress.
Determining forest structure
To distinguish between forest structural types, definitions of different structural categories must be employed. This research employs the definitions of structural stages utilized by TEM (i.e., sparse/bryoid; herbaceous; shrub/herbaceous; pole/sapling; young forest; mature forest; old forest). In order to differentiate between these stages, a combination of reference TEM and LiDAR data was utilized.
In direct contrast to passive optical sensors which are limited to providing detailed information on the horizontal distribution of forests (Lim et al. 2003), LiDAR sensors generate active pulses of near infrared light capable of penetrating vegetation canopy and able to provide high accuracy horizontal and vertical information at a variety of spatial resolutions (Lim et al. 2003). Active LiDAR systems obtain measurements by recording the distance traveled by NIR light sent from a laser transmitter to a target and back the laser receiver (Ritchie 1996). The ability of t his NIR energy to penetrate canopy and retrieve information on both vegetation and the ground surface has important implications for the measurement of vegetative characteristics. Specifically, NIR light pulses can directly measure the vertical distribution of vegetation and can thus be used to extract detailed information on vegetative structure.
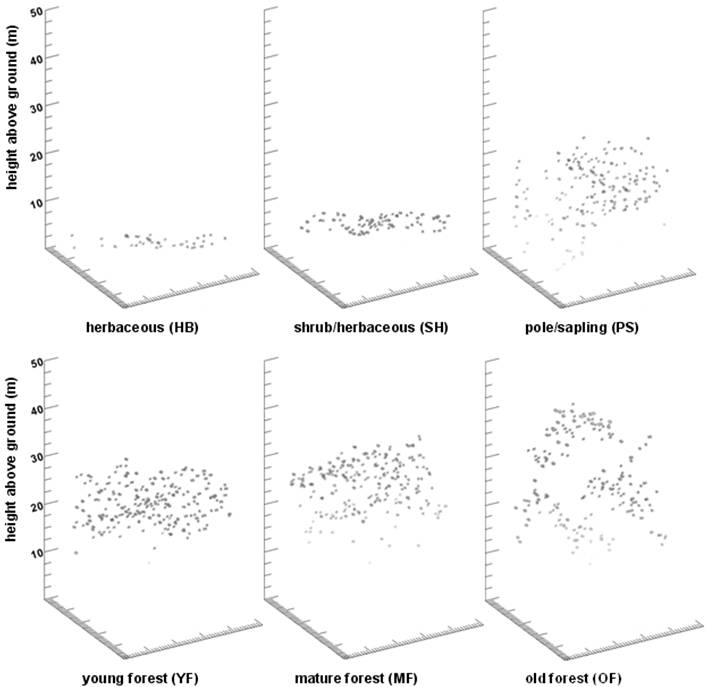
For this research, LiDAR data were collected by a Mark II small-footprint discrete return airborne laser altimeter. Mark II LiDAR data actively abstracts electromagnetic NIR energy at a band center of 1064 nm, with an approximate band width of 10 nm. When flown at an approximate altitude of 1600 m, the Mark II has a footprint of 0.8m. Within targeted areas of terrestrial ecosystems in the GINPR and its surrounding non-Park lands covered by LiDAR transects, distributive descriptors, height percentile metrics and a modified canopy volume profiling approach were used to describe the three-dimensional volumetric properties of forest canopy. Targeted areas represented extant vegetated TEM structural stages. A one way analysis of variance (ANOVA) was used to determine which of the metrics were statistically significant in their ability to differentiate between TEM defined structural stages. Results indicate that certain metrics outperformed others, and that although many TEM structural stages can be differentiated successfully, the most structurally complex stages (i.e., mature and old forest) could not be differentiated form one another. Ongoing work in this realm of the research will involve determining statistical relationships between various LiDAR metrics and specific structural stages and using this information to predict TEM defined structural stage throughout the extent of flown transects.
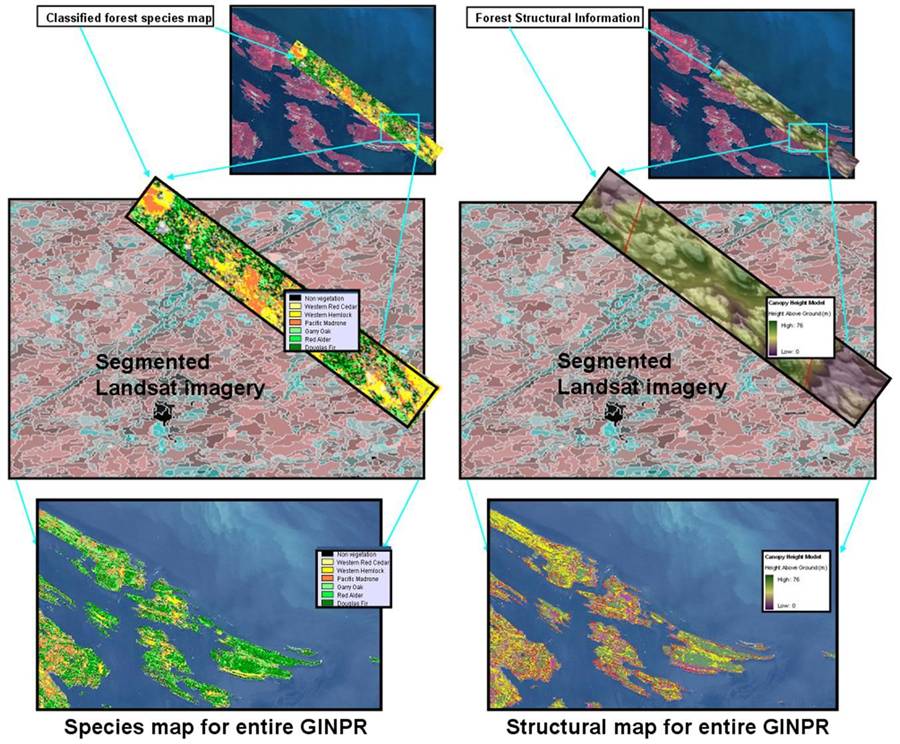
Extrapolation of species and structural information
Despite the merits associated with hyperspectral and LiDAR data, both have their limitations. Specifically, Hyperspectral data is limited to the horizontal plane and spatially limited to the extent of flown transects. LiDAR data, although not limited to the horizontal plane, is also spatially limited to the extent of flown transects. In order to provide Park Managers with the information they require, spatially explicit data representing the entire southern Gulf Islands is needed. Although not capable of providing the detailed species and structural information required, medium spatial resolution multispectral Landsat data is able to provide wall to wall coverage of the study area. For this research, medium spatial resolution multispectral data were collected by the Landsat 5 TM sensor (http://edc.usgs.gov/guides/landsat_tm.html). The portions of the EMS abstracted by the Landsat 5 TM include the visible, NIR, SWIR and thermal. Specifically, seven TM bands abstract electromagnetic energy in the blue (band 1: 450-520 nm); green (band 2: 520-600 nm); red (band 3: 630-690 nm); NIR (band 4: 760-900 nm); SWIR (band 5: 1550-1750 and band 7: 2080-2350 nm); and the thermal infrared (band 6: 10400-12500 nm) portions of the spectrum. The space borne nature of the Landsat 5 platform yields a spatial resolution of approximately 30 m (bands 1-5, 7) and 120 m (band 6).
The final stage of this research will be to combine these three disparate types of remotely sensed data (i.e., hyperspectral, LiDAR and Landsat TM), in order to take full advantage of all of their benefits, and in doing so, compensate for the shortcomings of employing any one type of these data in a standalone manner. To do so, Definiens Professional software will be employed to segment the Landsat TM image, as an object-oriented Landsat image is able to appropriately represent the distribution of vegetated stands dominated by various species/structural attributes. Following segmentation, statistical relationships between image objects and the AISA derived forest species classifications, as well as with predicted structural stages will be determined. Specifically, empirical relationships present between areas of overlapping Landsat segments and species and structural data will be used in regression relationships to extrapolate these relationships to the extent of the southern Gulf Islands. The final product aims to be detailed species and structural information covering the full spatial extent of the southern Gulf Islands.